
Observing Randomness

Monitoring distributed systems is a challenge. While there are established patterns and solutions for monitoring the most common types of applications, there is usually no silver bullet. In this blog post, we outline the challenges that we faced when implementing monitoring for one such system, drand.
What is drand?
Drand is a public, verifiable, unpredictable, and unbiased randomness beacon. It is based on the idea that to generate randomness in a reliable and trustworthy way, you cannot depend on a single entity to control the infrastructure where it runs. This led us to seek the collaboration of multiple organizations to run their own drand daemons, forming The League of Entropy (LoE)—a distributed organization where each participating partner runs a drand node.
A drand network is composed of multiple nodes. Each network generates separate randomness beacons at specific intervals, called rounds. The number of nodes on a network is fixed at any given point in time and only changes during a ceremony. During the ceremony, a threshold is set, which is the minimum number of nodes that need to be connected to the network at any given time for randomness generation to succeed.
📈 The Need for Monitoring
To ensure security, we do not allow just any host to join the network at any time. Whenever a host joins or leaves the network, we hold a “ceremony” where cryptographic keys are refreshed and exchanged. In between ceremonies, the list of hosts that participate in a drand network is static. Ceremonies are usually held quarterly, and before each ceremony, an allow list containing the IP addresses of all nodes in the network is distributed to all participants to open the appropriate firewall ports.
Coordinating these ceremonies presents several challenges:
- Synchronous Operation: All node operators need to be online simultaneously to execute commands correctly.
- Version Mismatch: Nodes might be running different versions of
drand, leading to failures. - Connectivity Issues: Nodes might have connectivity problems that prevent proper participation.
To address these issues, full visibility into the drand network and the state of each node is essential. Our goal is to enable asynchronous ceremonies where operators can execute commands within a timeframe without being online simultaneously. A monitoring tool providing an accurate view of nodes and network states is necessary.
📏 Monitoring Architecture Requirements
To properly monitor the drand network, we have the following requirements:
- Allow any LoE member to create their own monitoring infrastructure: Organizations can select the metrics aggregation platform that best meets their needs.
- Ease of deployment: Modify the drand binary to export metrics without adding a new binary.
- Minimize the need for opening network ports: Ideally, no network ports other than the one used for generating randomness should be opened.
- Use industry-standard formats where possible: Use an industry-standard format to publish metrics.
- Ability to see the state of the whole network from any point in the network: Enable each node to provide a full view of the whole network.
- (Close to) real-time view of the network state: Ensure changes in node state are seen quickly, especially during ceremonies.
📐 Design Decisions
Our requirements led to the following design:
- Each node exposes its own metrics in Prometheus format: Prometheus is an industry-standard format, and each node exposing its own metrics allows direct monitoring of individual nodes.
- Each node can retrieve other nodes’ metrics and expose them in Prometheus format: This enables not only Protocol Labs but any LoE member to create their own dashboards showing the state of the whole network.
- Metrics transport uses the same mechanism as inter-node communication for generating randomness (GRPC): By using GRPC, we allow metrics to be sent between nodes without requiring additional network ports.
- Gather metrics using Telegraf and export them to InfluxDB, accessed via Grafana Cloud: This setup centralizes metrics and creates an easy-to-use dashboard with a one-minute scraping interval, which can be lowered during ceremonies for faster updates.
📊 Metrics Design
We decided to monitor the following minimal information for running a smooth ceremony:
- Version of
drandthat the node is running. - Whether nodes have restarted their daemon ahead of the ceremony to ensure that the certificate is still valid and to clear the process’ memory and storage.
- Whether nodes have connectivity to all other nodes.
- The current ceremony state of the node.
For ongoing monitoring, we added the following for each beacon in each node:
- When the last randomness was generated.
- The last round generated by the node for that beacon chain.
- The time difference between nodes (including network round-trip times).
📡 Inter-Node Communications
As mentioned above, one of the requirements was to be able to view the state of the whole drand network without requiring node operators to open any additional holes in their firewall, nor to connect to any hosts other than those included in the drand network itself. Therefore, it was necessary to enable the possibility of fetching a remote node’s metrics via the same method used to coordinate randomness generation: that is, through GRPC.
We also wanted to reduce the amount of metrics traffic between nodes, so we went with a pull system where any node can pull any other node’s metrics when requested. For that, we exposed an additional HTTP endpoint that includes the peer’s ID to get Prometheus metrics for the associated peer. A request to that endpoint makes a GRPC call to the remote node to get the metrics before returning them to the client. With this, we have the ability to get metrics from all nodes in the drand network without any unnecessary additional traffic.
The Protocol Labs nodes all run instances of Telegraf, whose configuration is hard-coded to get the metrics from all nodes in the drand network. This is possible because the nodes in the network are static and only change during ceremonies. Telegraf then pushes the metrics into InfluxDB. We then use Grafana to visualize the data.
Regarding LoE members, the fact that metrics are exposed using the industry-standard Prometheus format and that any node can gather metrics from any other node in the network makes it possible for any of them to create a setup similar to this and gather metrics into their own observability solution.
📉 Dashboard Design
As is usually the case, it took multiple iterations to get to a dashboard design that was useful and also comprehensible. These iterations involved both changing the layout and organization of the presented information, as well as adding metrics that were missed during initial analysis. For example, during ceremonies some of the state changes happen so fast that they were missed by the polling and dashboard refresh intervals, so we added timestamps to be able to see whether a state had changed or not. We also reformulated some metrics labels to reduce cardinality.
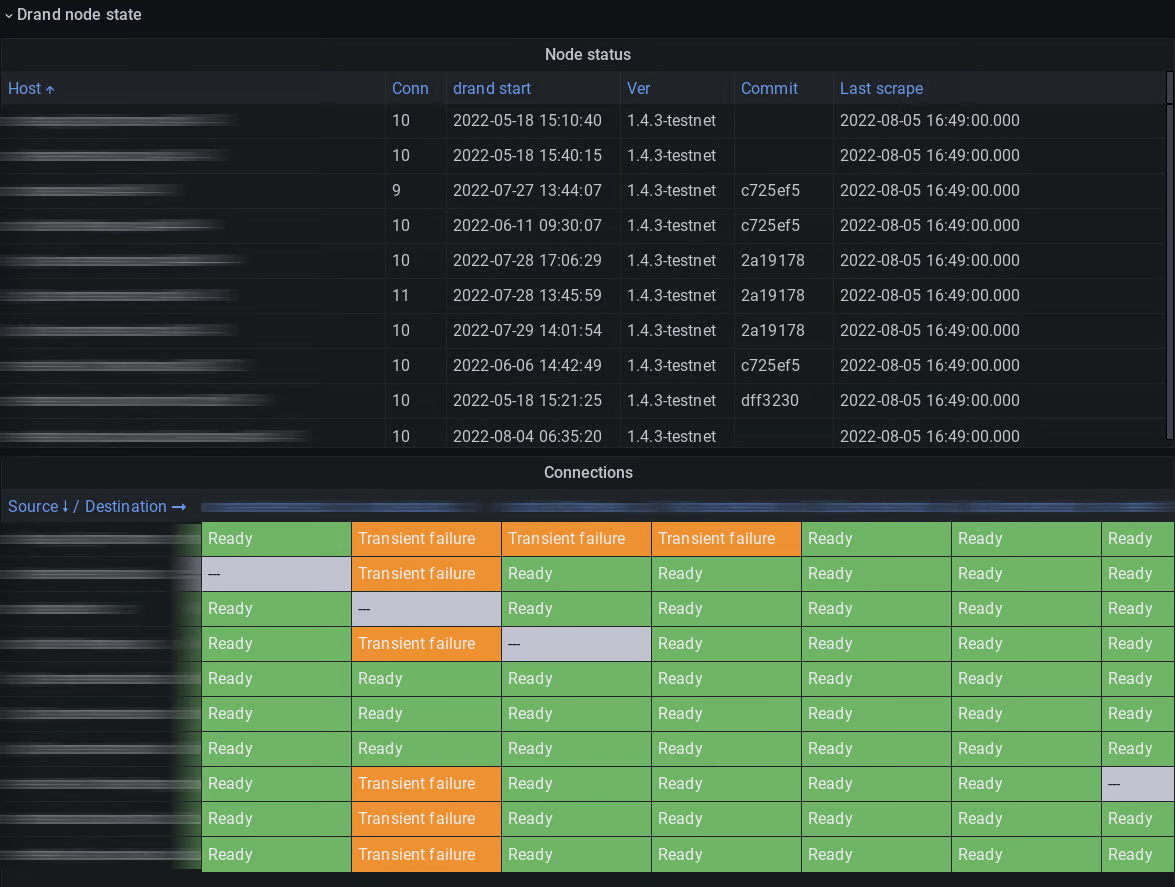
We ended up with a dashboard with two sections. The first section includes connectivity information for each node, as well as a connectivity matrix showing which nodes are connected to which other nodes. This has enabled us to find problems such as firewall misconfigurations or bugs impacting connectivity.
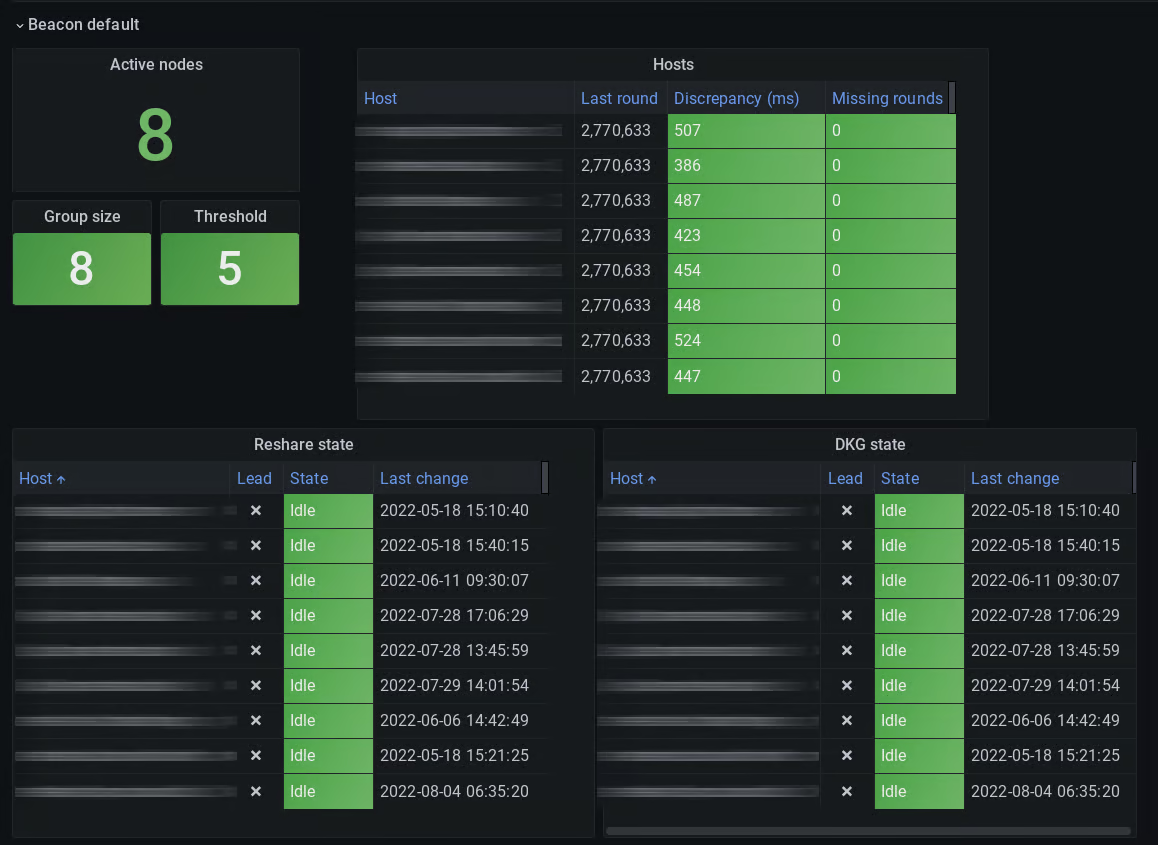
The second section contains information about each of the beacons in the given network, including the ceremony state for each node. This allows us to track ceremonies, as well as ensuring that all nodes are up to date with all other nodes.
🏆 Results
We have already deployed and used the new dashboard in the last set of ceremonies that we carried out in our testnet network. It has proven to be an extremely useful tool. We were able to spot connectivity problems and other inconsistencies in a totally asynchronous manner, which in turn enabled us to resolve issues much faster. This has given us confidence to run the next testnet ceremony in an asynchronous manner, without having to coordinate all operators being in front of their keyboards at the same time.
Beyond ceremonies, we now have a much more detailed view of the state of the LoE drand network.
Next Steps
As is the case with pretty much any software tool, many more features can be added and several of the existing ones can be optimized. However, what we have is already a big step forward and gives us much higher confidence in the process, compared to the ceremony procedure we used to have.
Some of the issues we have found that we would like to fix in future versions of the monitoring infrastructure are:
- Consistency: We sometimes see some measurements toggling between two numbers in the dashboard. The reason for this is, we are gathering metrics from all hosts and storing them in Influx DB. However, some of these metrics are system-wide, and since this is a distributed system, some hosts might have slightly different views of the state of the network than other hosts (especially during ceremonies). While this is not a widespread problem, it can be confusing.
- Visibility of New Nodes: When a new node joins the network, we are unable to see
it in the dashboard until the ceremony is finished. We would like to have some way of monitoring the state of a new node.
- Visibility in the Case of Connectivity Problems: Since we are scraping the metrics from the Protocol Labs nodes, if a node cannot connect to any of them, we cannot gather its metrics. While this is mitigated by scraping from all Protocol Labs nodes instead of just one, we still run the risk of missing a node’s metrics if it cannot connect to any Protocol Labs nodes.
Suggested References for Further Reading:
- Random Number
- Threshold Cryptography
- Public Key Infrastructure
- Verifiable Random Function
- Prometheus (software)
- GRPC
- Asynchronous System